
Fig. 4.
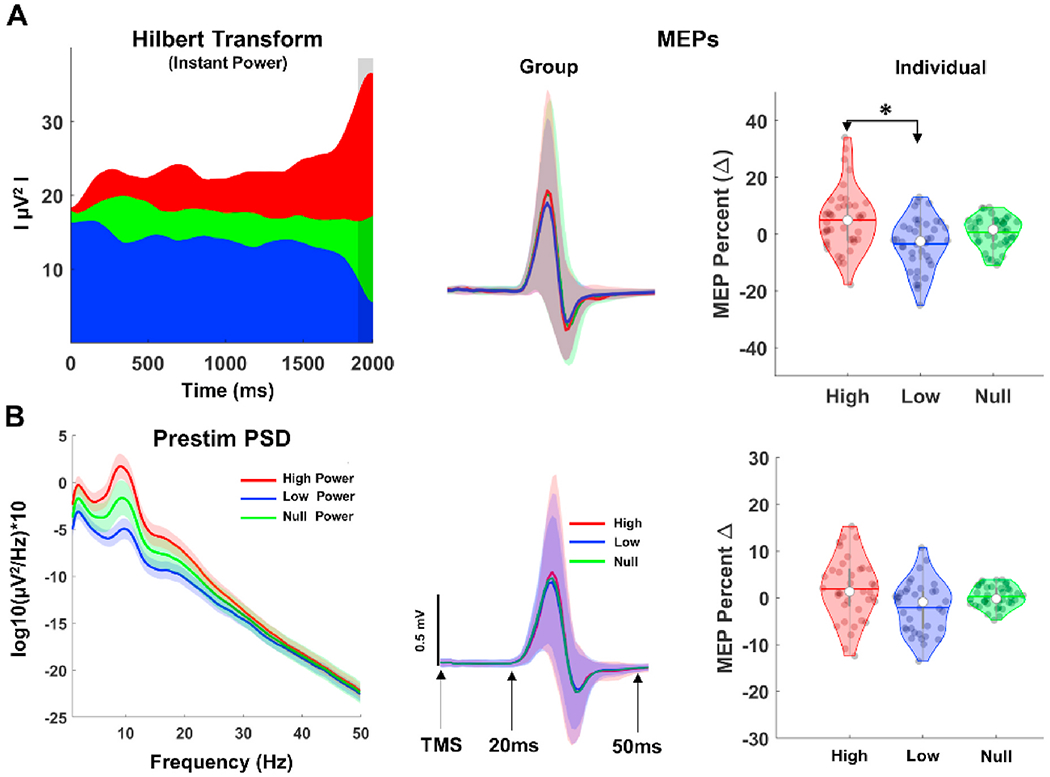
Instantaneous and Pre-stimulus EEG Power Estimation and Power-based MEPs. A: Grand average instantaneous power (left panel) and corresponding MEP time series (middle panel). Vertical gray shaded region in the power panel show time window (−100 to 0 ms) for computing instantaneous power at the time of TMS, and colored shaded regions in the MEP time series panel show standard error of measurement (±1 unit). B: Grand average PSD (left panel) of all trials and visits before TMS (−2000 to 0 ms) and MEP time series (middle panel). Violin plots (right panels) showing distribution of normalized MEPs for each subject across power conditions.