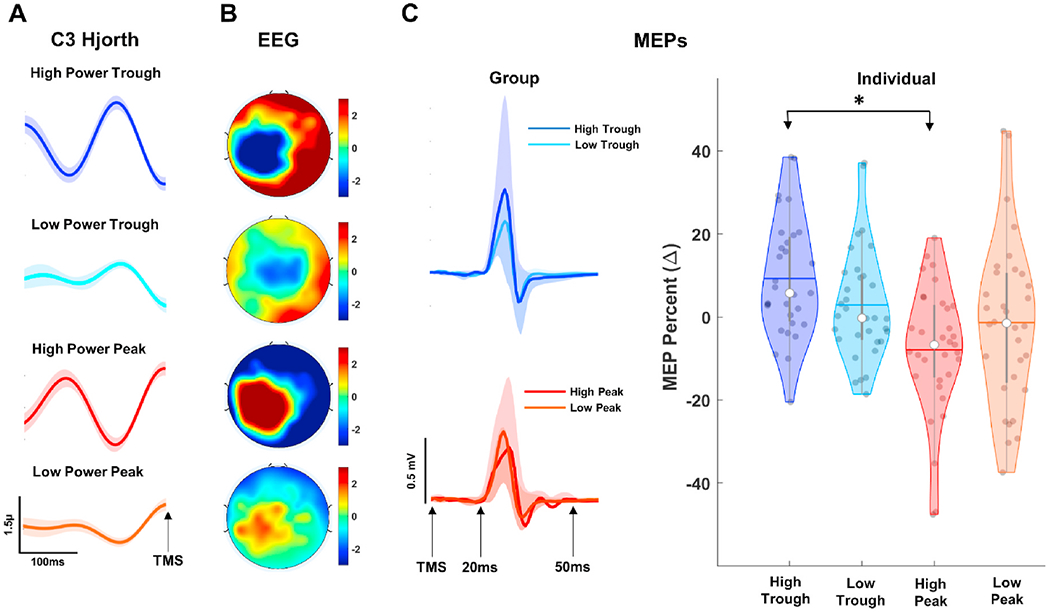
Fig. 5.

MEP Classification as a Function of EEG Phase and Power. A: Grand average Hjorth-transformed C3 time series for High-Trough (first panel from top), Low-Trough (second panel from top High-Peak (third panel from top), and Low-Peak (last panel). Shaded regions show standard error of measurement (1 unit). B: Scalp distribution of grand average EEG activity at the time of TMS across all trials and visits for combination of phase and power trials described in A. C: MEP time series (left panels) and violin plots (right panel) showing distribution of normalized MEPs for each subject across phase conditions. Shaded regions in left panels show standard error of measurement (±1 unit). White dots in violin plots represent median for normalized MEPs while gray colored dots show distribution of individual MEPs. Colored horizontal lines and gray vertical bars represent grand average values and interquartile ranges, respectively.
