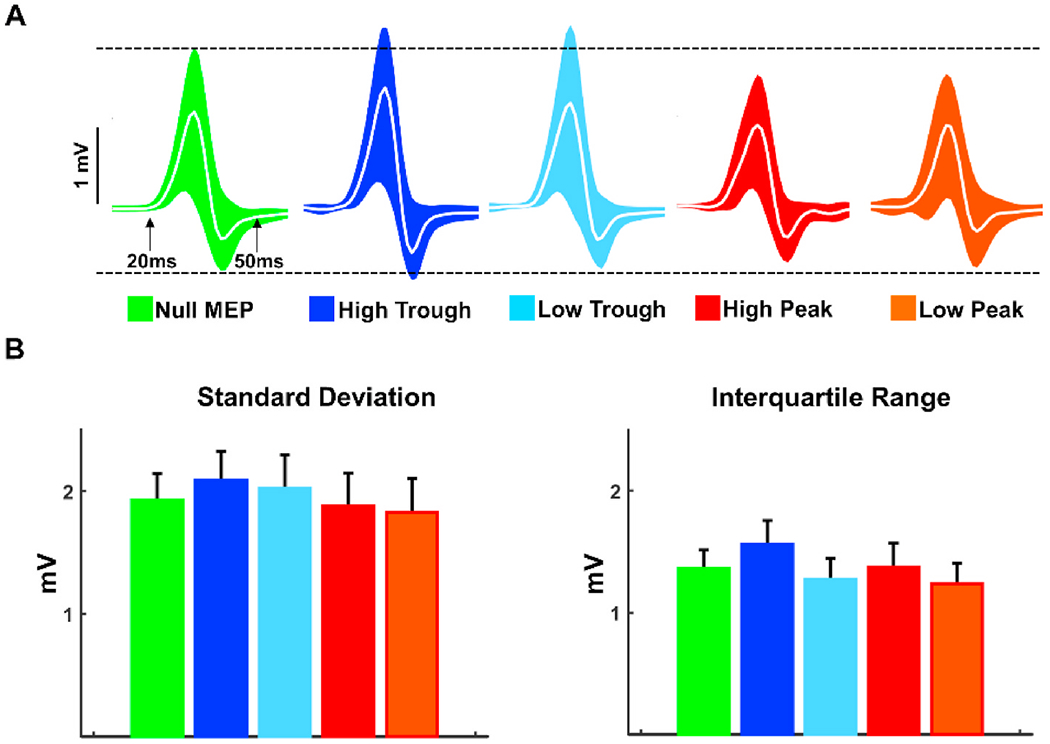
Fig. 7.

MEP Variability Across mu Phase and Power conditions. A: MEP time series across visits for each condition. Colored regions represent standard deviation (±1 unit) straight lines (white) show grand average. Black dotted lines were placed on the upper and lower edges of Null MEP trials as a reference for power and phase based conditions. B: Color-coded averages of subject level standard deviations (left panel) and interquartile ranges (right panel) of MEPs across visits. * denotes statistically different comparisons with Bonferroni correction. (For interpretation of the references to color in this figure legend, the reader is referred to the Web version of this article.)
