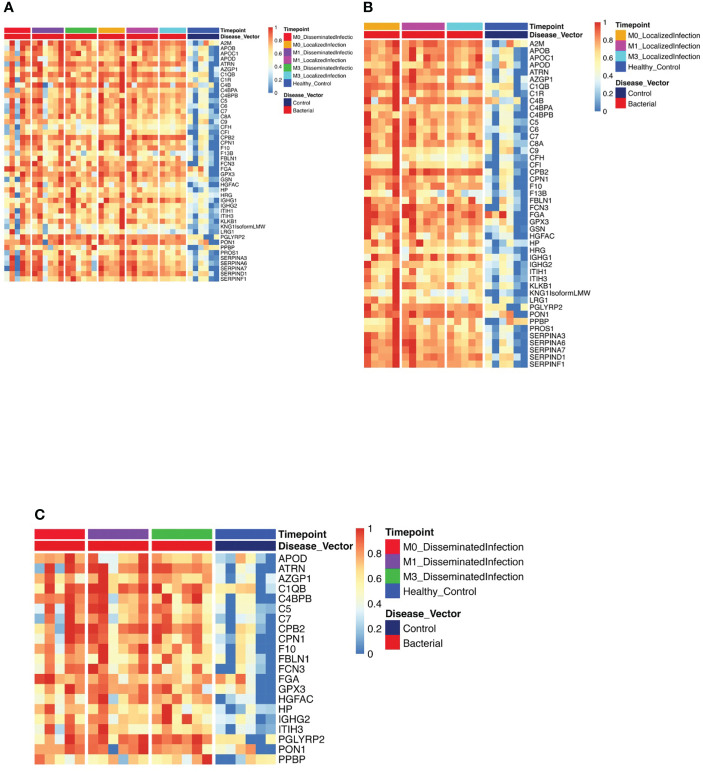
Figure 1.
Protein Expression across Lyme Disease Timepoints. Serum samples from LD patients were assessed by the dHSP platform. The limma package was used to identify differentially expressed proteins in a combined dataset of healthy controls and patients with statistically significant proteins defined with FDR ¾= 0.05. (A) Normalized heatmap displays the progression of abundant proteins (n=46) in both disseminated and localized infections at month 0, 1, and 3 (M0, M1, M3) compared to healthy controls. (B) Normalized heatmap displays the progression of abundant proteins (n = 66) in localized infections at month 0, 1, and 3 (M0, M1, M3). (C) Normalized heatmap displays the progression of abundant proteins (n = 22) in disseminated infections at month 0, 1, and 3 (M0, M1, M3).

