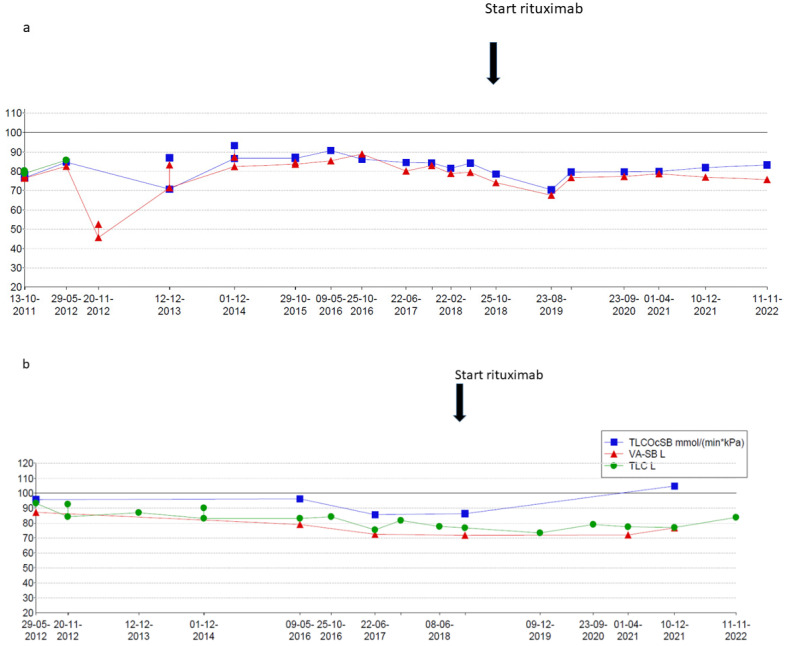
Figure 5.
(a) Lung function over time (forced expiratory volume in 1 s (FEV1) in blue and forced vital capacity (FVC) in red expressed as percent predicted of normal. (b) Total lung capacity (TLC) in green measured by body plethysmography and total lung capacity measured by CO-dilution technique (TLCO-SB) in green and alveolar volume (VA-SB) in red. All values are expressed as percentage predicted of normal.

