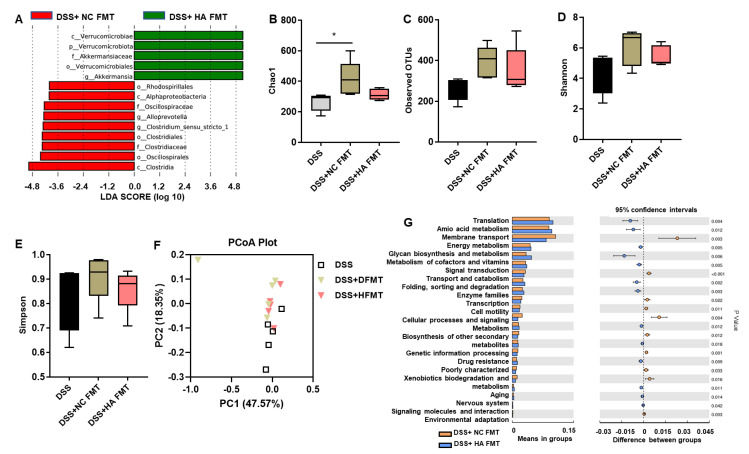
Figure 6.
FMT from colitis mice treated with HA increases the abundance of Akkermansia muciniphila. (A) The LefSe analysis of the DSS + NC FMT group and DSS + HA FMT group. (B–E) The α-diversity analysis of the gut microbiome at the OTU level, determined by the Chao1, Observed OTUs, Shannon and Simpson index. (F) The β-diversity analysis by principal component analysis (PCA) plot. (G) The microbial predicted metabolic functional data using Tax4Fun method. Data are expressed as mean ± SE, n = 5, * p < 0.05.

