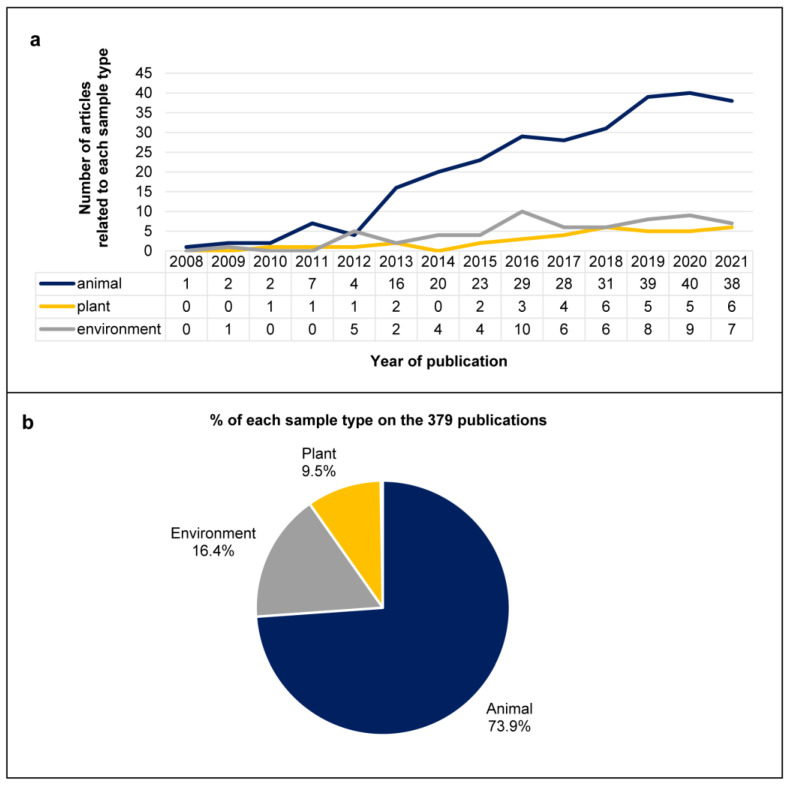
Figure 2.
Summary of the publications included in the study per year and per type of sample. (a) Trend for annual publication: each column represents the number of articles by year of publication, from 2008 to 2021, divided by type of sample (environment, animal, plant). (b) Percentage of each sample type of the 379 publications: animal (dark blue), environment (light blue), yellow (plant).

