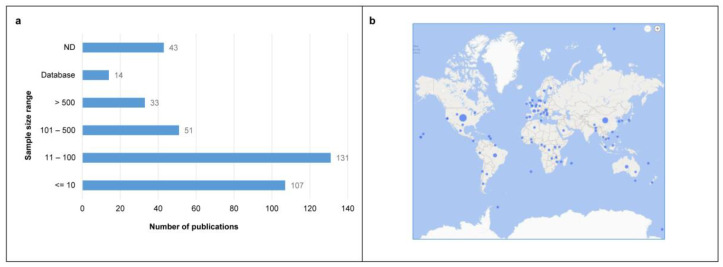
Figure 3.
Sample size and geographical provenience. (a) Number of publications for each sample size range; X axes: number of publications, Y axes; sample size range. ND: sample size not specified. (b) Map showing the geographical provenance of the samples; dots indicate the samples/publications (dot dimension reflects different publication numbers). (b) was generated with Bing Maps add-on for Microsoft Office Excel.

