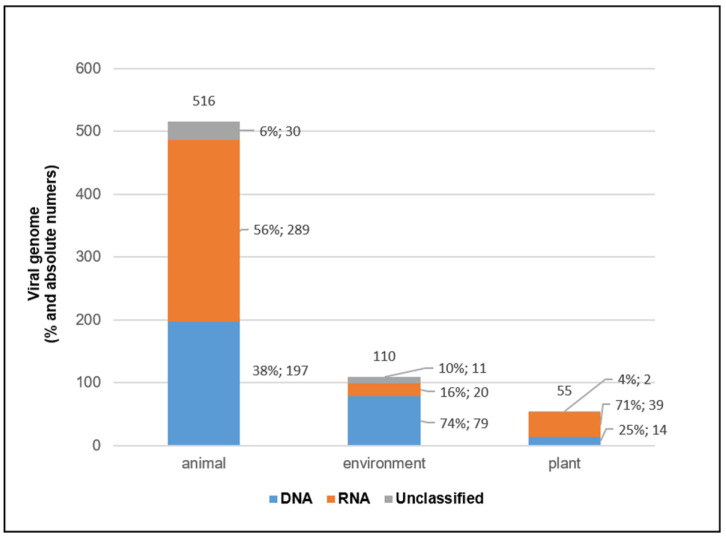
Figure 8.
Viral Genomes. The graph shows viral genomes of the identified viruses: DNA (blue bar), RNA (orange bar) and unclassified (gray bar) identified in the three sample types (animal, environment, plant). The number of viruses (percentage and absolute number) for each genome type is indicated on the side of the bars. X axis: DNA or RNA genomes in different sample types; y-axis: viral genomes.

