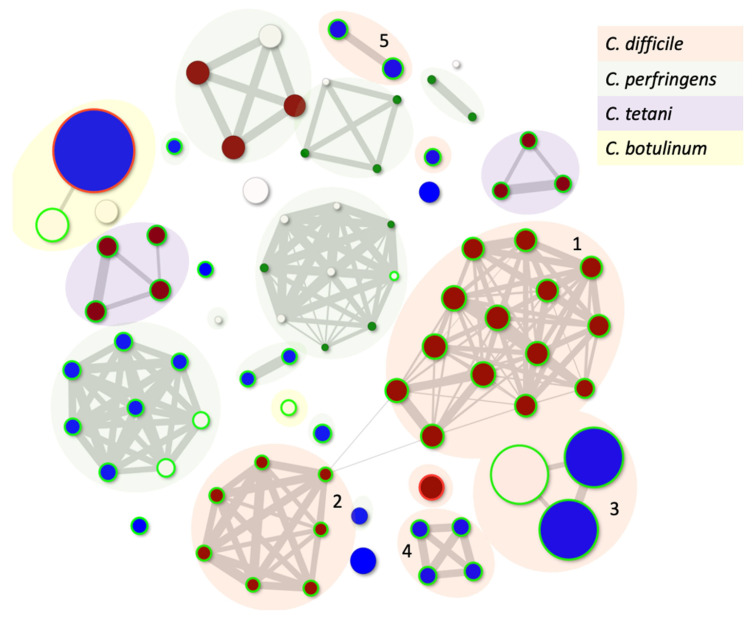
Figure 1.
Genetic relationships between all known Clostridial phages that can either independently plaque on bacterial hosts or can be induced from their host strain. The size of the dot is related to the genome size, and the colour is reflective of the morphology with red being a myovirus, blue siphovirus and white where the taxonomy is unknown. The green circle suggests the phages are temperate using Phage Leads, and the red circle shows that the phage carries an antibiotic resistance gene. Clouds numbered 1–5 represent clusters of C. difficile phages (Table S1). Phages included in the analysis are listed in Table S1.

