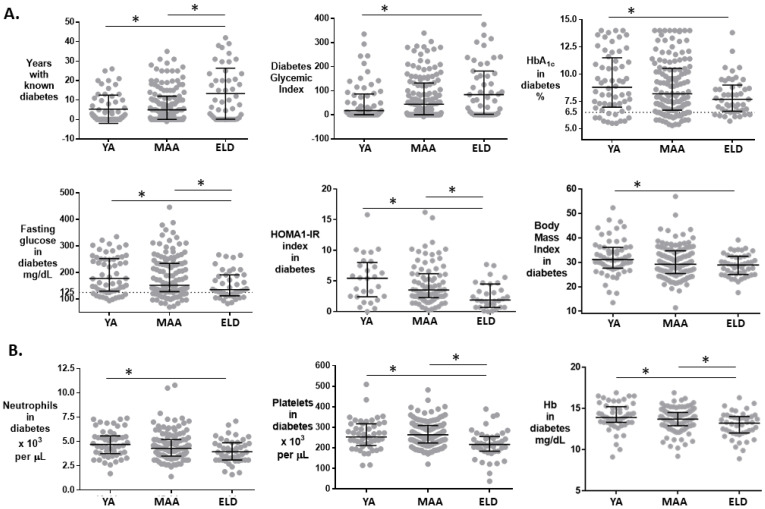
Figure 4.
Characteristics of T2D participants by age groups. (A) Features of T2D history, glucose control, insulin resistance or BMI, by age groups. (B) Complete blood counts and differential (only significantly different features shown). Horizontal lines, median (IQR); *, p ≤ 0.099 vs. ELD group; dotted lines, cut-off for normal glycemia or HbA1c. Each dot represents a T2D participant without TB. Abbreviations: HOMA1-IR, homeostasis model assessment-estimated insulin resistance index; Hb, hemoglobin.

