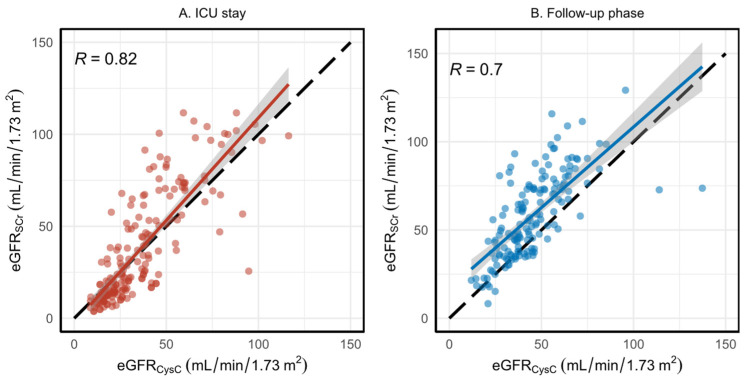
Figure 2.
Estimated glomerular filtration rate (eGFR) comparison using SCr and CysC in ICU stay and follow-up phase. (A) shows the comparison during ICU stay and (B) sows the comparison during follow-up phase. The red and blue curves are fitted linear regression models in ICU and follow-up, respectively, and the faded zones are the confidence intervals around the lines. The black dashed line shows the identity line.

