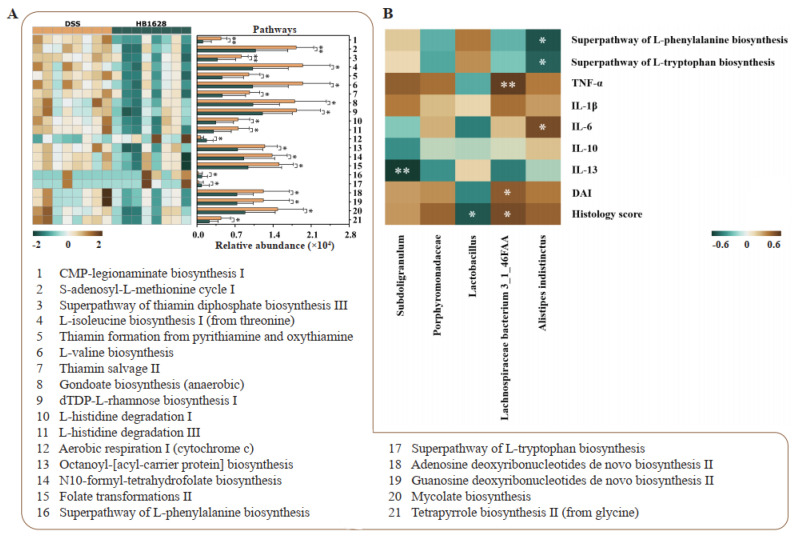
Figure 6.
Gut metagenomic potential and correlation analyses. (A) Significant differences in the gut metagenomic potentials between the DSS (colitis) and HB1628 (colitis and postbiotic intervention) groups (n = eight per group). The color scale represents the relative abundance of specific pathways encoded in the fecal metagenome (ranging from a high relative abundance [2; dark brown] to a low relative abundance [−2; dark green]). The error bars represent the standard deviation. (B) Correlation heat map of the Spearman’s rank correlation coefficient between the differentially abundant taxa and various parameters. The color scale represents the strength of the correlation coefficient (ranging from 0.6 [brown, a strong positive correlation] to −0.6 [green, a strong negative correlation]). * represents p < 0.05; ** represents p < 0.01. TNF = tumor necrosis factor; IL = interleukin; DAI = disease activity index.

