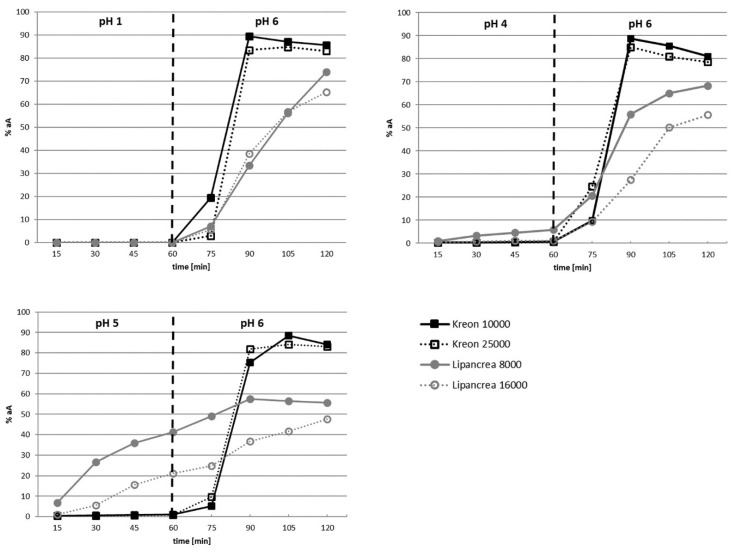
Figure 2.
Kinetics of enzyme release at pH 1.0, 4.0, 5.0 and 6.0. NOTE: on the y-axis, the enzyme amount is normalized to the actual assay of the respective product to compensate for different strengths (as per label claim) but also for overages up to 10%, which have been observed in the assay (compared with Table 2). The vertical dotted line represents the change in pH.

