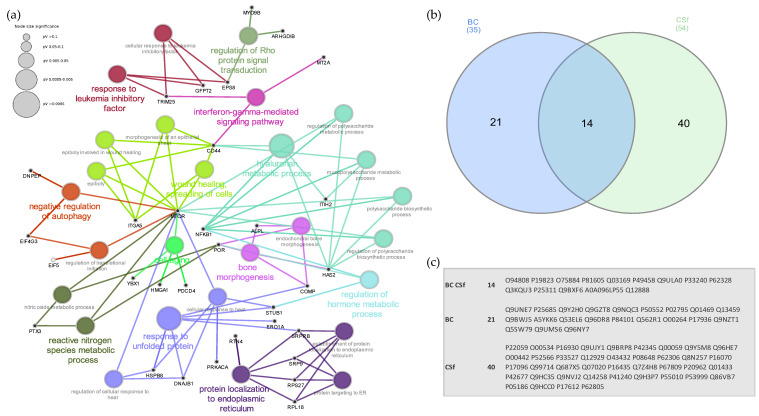
Figure 4.
(a) Enriched GO network groups using ClueGO/CluePedia-based enrichment. A network view for GO Biological Processes of differentially regulated proteins following BC and CSf treatments. Terms (each represented as node) are functionally grouped based on shared genes (kappa score ≥ 0.4) and are shown with different colors representing the class to which they belong. The specific players (proteins) of each node are highlighted with the respective gene name (in black). The size of the nodes indicates the degree of significance. Within each class, the most significant term (indicated with colored and bold characters) defines the name of the group. Ungrouped terms are not shown. (b) Venn diagram showing the overlapping of differentially expressed proteins after BC (blue) and CSf (green) treatments. Details of the UniProt accession numbers within each subset of the Venn diagram are reported in (c).

