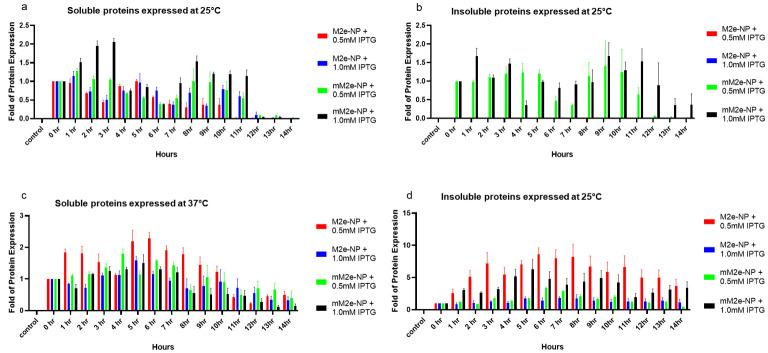
Figure 4.
Folds of protein expression compared to the fusion proteins harvested at 0 h (prior to the addition of IPTG). The upper and lower panels represent protein yields at 25 °C and 37 °C, respectively. (a) Soluble and (b) insoluble M2e-NP and mM2e-NP harvested at 25 °C, and (c) soluble and (d) insoluble M2e-NP and mM2e-NP harvested at 37 °C. The quantitaion was performed in triplicate (n = 3), the data were presented as mean ± SD.

