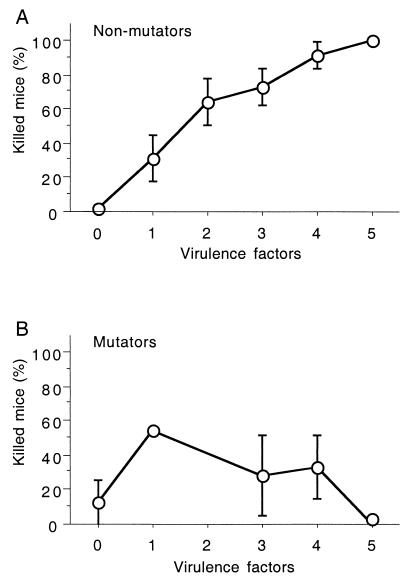
FIG. 1.
Comparison of the percentage of inoculated mice (10 to 50) that died and the number of virulence determinants (K1 antigen and sfa/foc, pap, afa, hly, cnf, aer, and ibe10 genes) per strain for the 80 nonmutator (A) and 8 mutator (B) natural E. coli isolates. The points refer to the mean values for all strains in the group with the indicated number of virulence determinants. The numbers of strains at each point in the curves for virulence determinants 0 to 5 are as follows: 32, 11, 14, 11, 9, and 3 (A) and 2, 1, 0, 2, 2, and 1 (B). Standard error bars are also presented. The absence of the error bar in panel A reflects an absence of variation, whereas in panel B it reflects the presence of only one studied strain.

