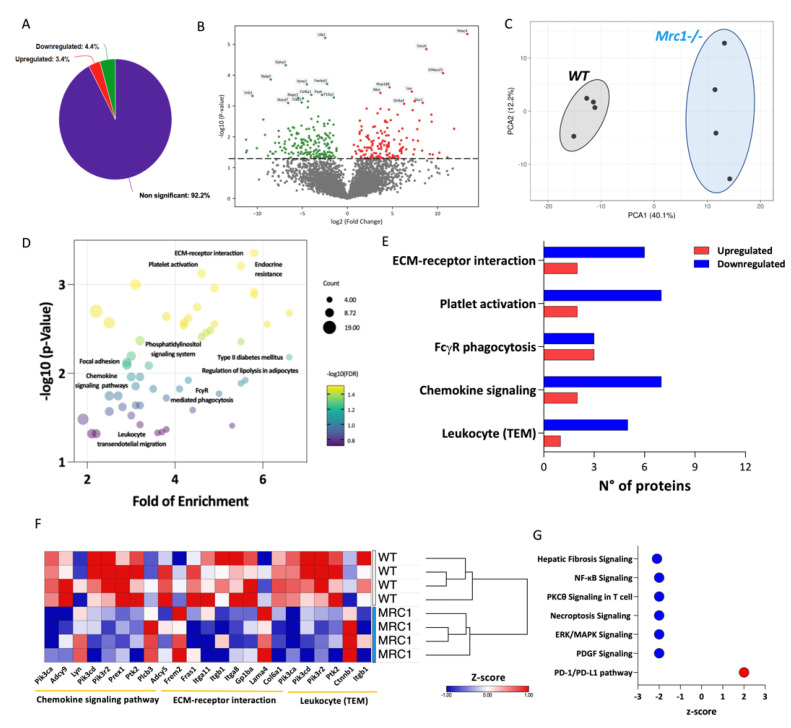
Figure 2.
Plasma proteomics profiling of Mrc1−/−and WT mice fed with an HFD for 20 weeks. (A) Percentage of significantly upregulated (red), significantly downregulated (green), and unchanged (purple) proteins in the plasma from Mrc1−/−mice compared to WT. (B) Plasma proteome volcano plot showing log2 fold of change (x-axis) and the −log10 p-value (y-axis) of Mrc1−/− mice versus WT (upregulated proteins are shown in red, p < 0.05, FC > 1; downregulated proteins are shown in green, p < 0.05, FC < −1). (C) Principal component analysis (PCA) of the plasma proteome from WT (grey ellipse) and Mrc1−/− (blue ellipse). (D) Dot plot showing fold of enrichment (x-axis) and the –log10 p-value (y-axis) of enriched pathways following KEGG database analysis. (E) The number of up- and downregulated proteins within the enriched pathways following KEGG database analysis. (F) Hierarchical clustering and heatmap showing relative protein expression values (Z-score transformed LFQ protein intensities) of significantly different proteins between WT and Mrc1−/−mice of the indicated KEGG pathways. (G) Downregulated or upregulated pathways as per Ingenuity Pathway Analysis (IPA) of plasma proteome profile of Mrc1−/− compared to WT mice. Results are expressed as mean ± SEM, n = 8–10 mice per group.

