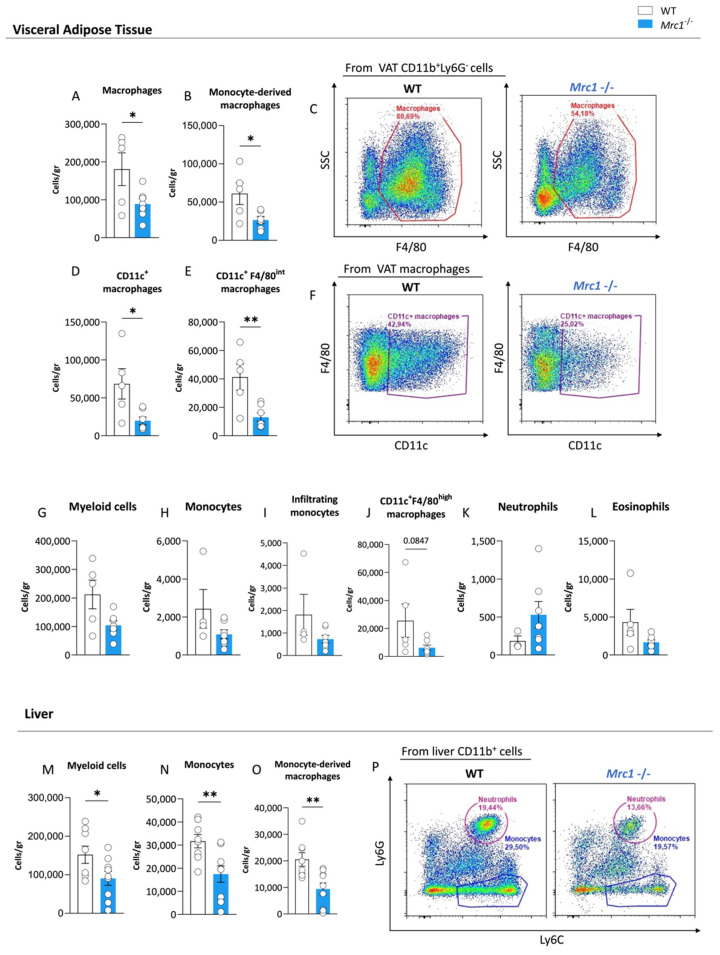
Figure 3.
Immune cell subset distribution in visceral adipose tissue and liver from Mrc1-deficient and WT mice fed with an HFD for 20 weeks. Macrophages (A), CCR2+ monocyte-derived macrophages (B), and a representative flow cytometry plot of macrophages in WT and Mrc1−/− mice (C) are shown. Inflammatory CD11c+ macrophage count (D) and CD11c+ F4/80int macrophage count (E) in the two experimental groups are shown. A representative flow cytometry plot showing CD11c+ macrophages in WT and Mrc1-deficient mice is shown in panel (F). VAT counts of myeloid cells (G), monocytes (H), CCR2+ infiltrating monocytes (I), CD11c+ F4/80high macrophages (J), neutrophils (K), and eosinophils (L) are shown. Liver myeloid cells (M), monocytes (N) and CCR2+ monocyte-derived macrophages (O), and representative plots showing neutrophils and monocyte distribution in the two experimental groups are presented in (P). Results are expressed as mean ± SEM, n = 5–10 mice per group. * p < 0.05; ** p < 0.01.

