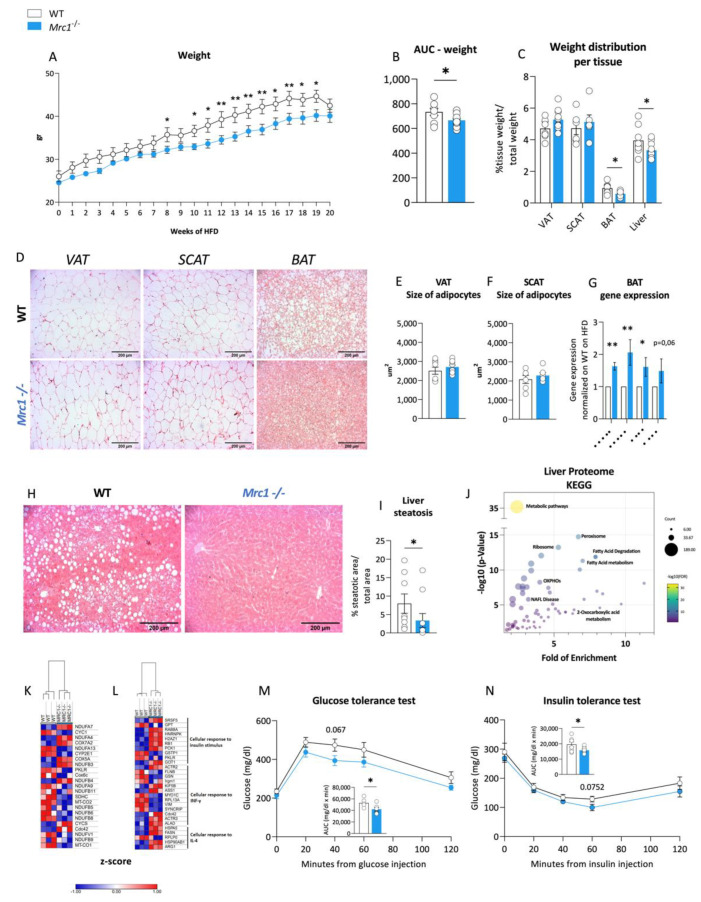
Figure 4.
Immune metabolic phenotype of Mrc1−/− mice and WT mice fed an HFD for 20 weeks. (A) Weekly body weight during 20 weeks of high-fat diet feeding for WT and Mrc1−/− mice; (B) area under the curve AUC and (C) organ/tissue weight distribution of the VAT, SCAT, BAT, and liver from WT and Mrc1−/− mice. (D) Representative images of hematoxylin and eosin-stained sections from left to right of visceral, subcutaneous, and brown adipose tissues from WT (first row) and Mrc1−/− mice (second row). The mean area as um2 of adipocytes within the VAT (E) and SCAT (F) for both experimental groups are presented. (G) Gene expression analysis of Ppara, Pgc1a, Atgl, Ucp1 in BAT from Mrc1−/− normalized to that of WT. Representative images of hematoxylin and eosin-stained sections of the liver from both experimental groups (H) and the prevalence of liver steatosis (I) are shown. (J) Dot plot showing fold of enrichment (x-axis) and the –log10 p-value (y-axis) of enriched pathways following KEGG database analysis. Hierarchical clustering and heatmap showing relative protein expression values (Z-score transformed LFQ protein intensities) for proteins with significantly different expression in WT and Mrc1−/− mice (non-alcoholic fatty liver disease, NAFLD (K) and other relevant pathways (L),FDR < 0.05). (M) Glucose tolerance test (GTT) performed at 20 weeks of HFD feeding in WT and Mrc1−/− mice and calculated AUC. (N) Insulin tolerance test (ITT) performed at 20 weeks of HFD feeding in WT and Mrc1−/− mice and calculated AUC. Blood glucose levels are shown. Glycaemia was measured before i.p. glucose or insulin injection (t = 0, baseline values) and after 20, 40, 60, and 120 min. Results are expressed as mean ± SEM, n = 8–10 mice per group. * p < 0.05; ** p < 0.01.

