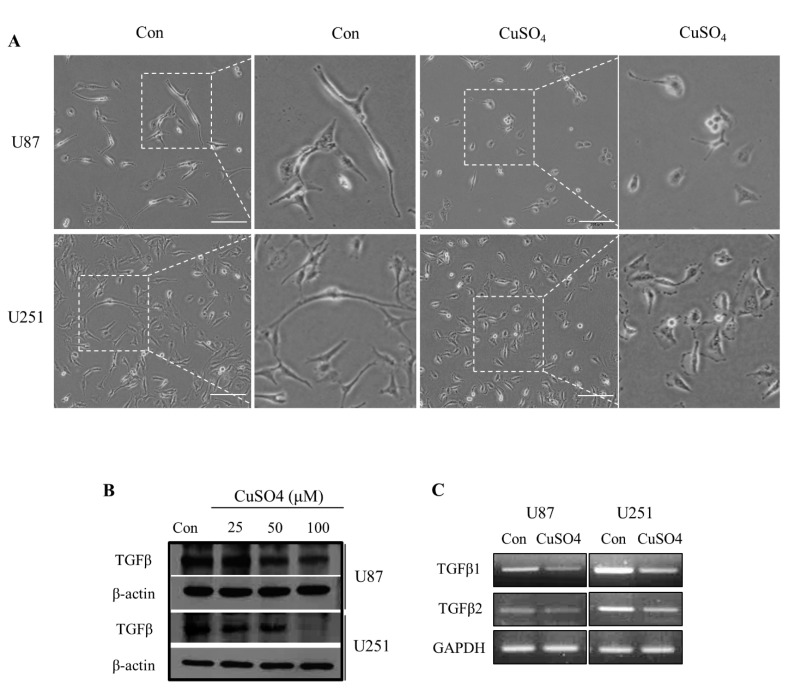
Figure 1.
(A) The effect of control and 100 μM CuSO4 on morphology of U87 and U251 cells seeded in dishes and treated for 24 h. Scale bars: 100 µm. (B) The change in expression levels of TGF-β in GBM cells treated with CuSO4 (25, 50, and 100 µM). (C) The mRNA expression levels of TGF-β1 and 2 in cells treated with 100 µM CuSO4.

