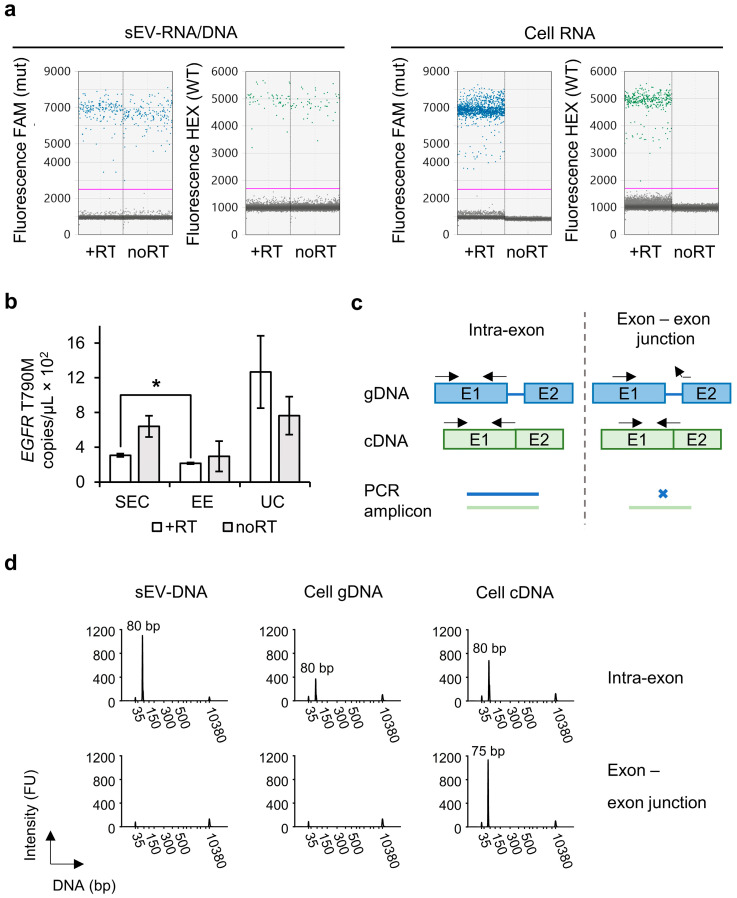
Figure 3.
H1975 cell line sEV-derived genomic DNA provides a major template for EGFR T790M mutation detection. (a) Fluorescence intensities of mutant (FAM, mut) and wild-type (HEX, WT) obtained by a X200 Droplet Digital PCR System. Data are shown as 1D droplet amplitude with the threshold (pink line) separating positive from negative droplets. The sEV-derived RNA/DNA obtained by SEC and cellular RNA samples were used for cDNA synthesis using reverse transcriptase (+RT) or left untreated (noRT). (b) Concentration of EGFR T790M (copies/µL) in sEV-RNA/DNA obtained by ddPCR. Samples were prepared with reverse transcriptase step for cDNA synthesis (+RT, white) or left untreated (noRT, grey). Data obtained by SEC are compared to those of EE and UC methods. They are normalized to the same volume of conditioned culture medium used as starting material (90 mL) and represented as mean ± SEM (N = 3, n = 3). Statistically significant results are indicated by * for p-value ≤ 0.05. (c) The impact of PCR primer pair design on amplicon generation from gDNA (blue) and cDNA (green) containing both exons (boxes) and introns (lines) or only exons, respectively. Left: The intra-exon primer pair generates amplicons of the same length from both gDNA (blue) and cDNA (green). Right: The exon–exon junction primer pair generates an amplicon from cDNA, but not from gDNA. (d) Fragment length distribution profiles of PCR amplicons generated from sEV-RNA/DNA samples obtained by SEC, compared to cell-derived gDNA and cDNA. Intra-exon (top) and exon–exon junction (bottom) primer pairs were used for PCR. Analysis was done using a Bioanalyzer 2100 combined with the High Sensitivity DNA kit showing marker peaks at 35 bp and 10,380 bp. Small EV-derived samples were run undiluted and cellular samples were run after a 5-fold dilution. FU, fluorescence units; bp, base pairs.

