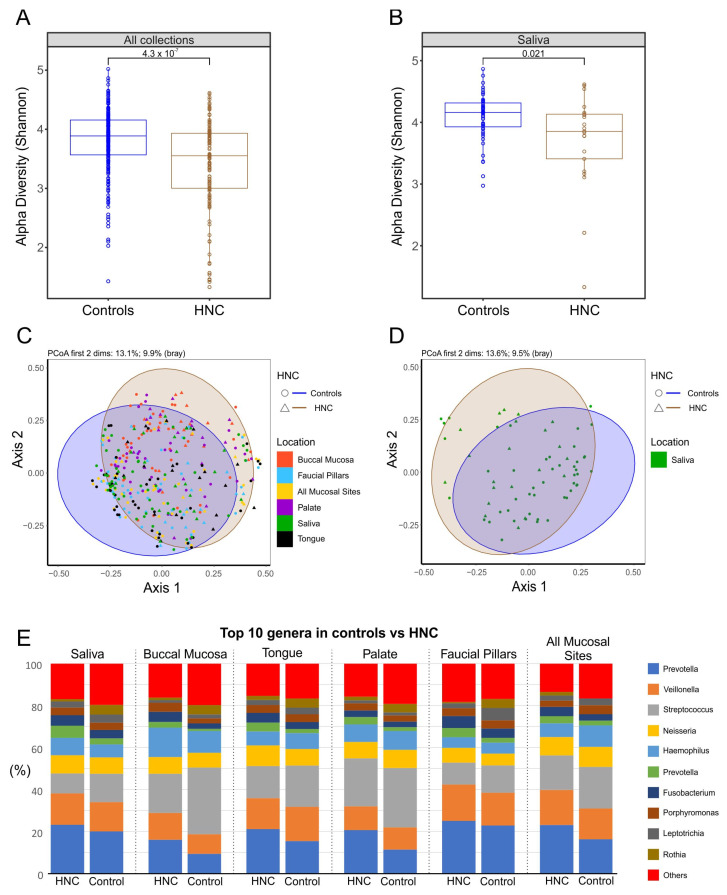
Figure 8.
Comparison of microbiomes between healthy controls and HNC: (A) alpha-diversity values when all sites were combined; (B) Alpha-diversity values when only saliva was analysed; (C) principle coordinate analysis (PCoA) of the relative abundances of OTUs between location using Bray–Curtis similarity analysis when all sites were combined; (D) principle coordinate analysis (PCoA) of the relative abundances of OTUs between locations using Bray–Curtis similarity analysis when only saliva was analysed; (E) top 10 genera at each site compared between healthy control and HNC.

