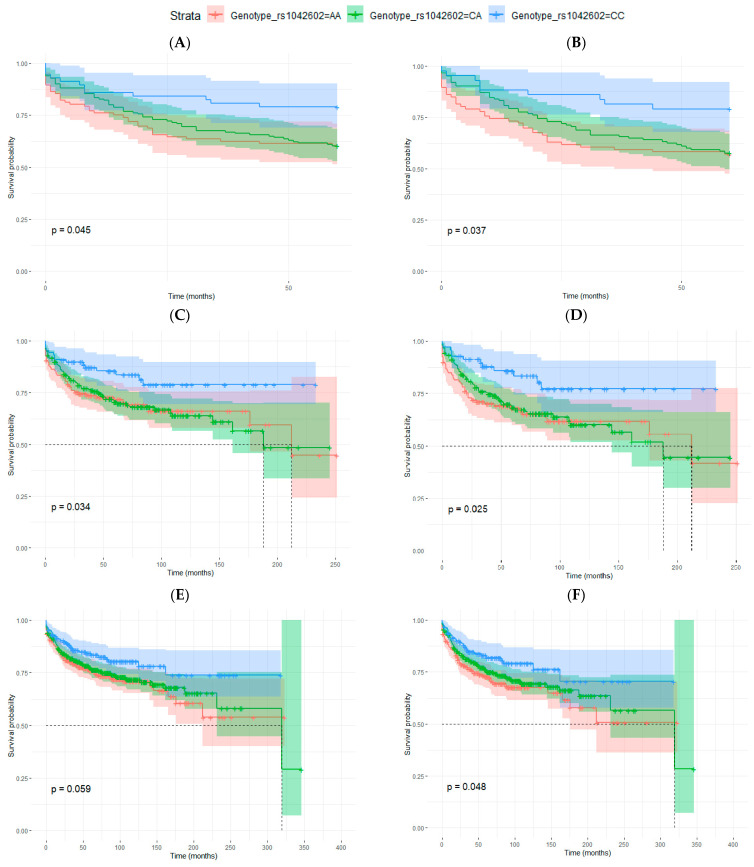
Figure 2.
Kaplan–Meier curves for disease-free survival (DFS) analysis in relation to rs1042602 genotype. (A,B) men with 5 years of follow-up: (A) all AJCC melanoma stages (p-value = 0.045) and (B) considering only stages I, II and III (p-value = 0.037), (C–F) patients with any follow-up period: (C) men, all AJCC melanoma stages (p-value = 0.034) (D), men, stages I, II and III (p-value = 0.025), (E) men and women, all AJCC melanoma stages (p-value = 0.059) and (F) men and women, stages I, II and III (p-value = 0.048). Log-rank test p-values are also indicated in each figure.

