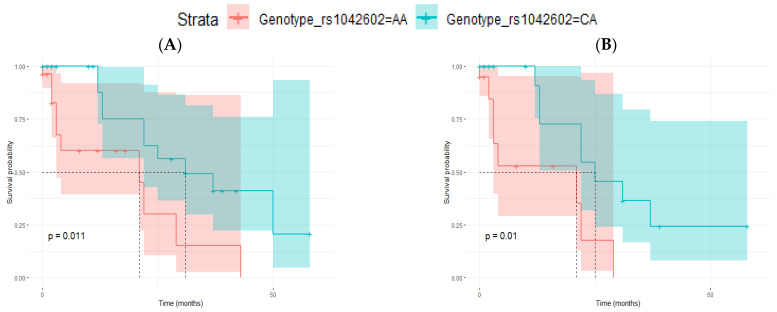
Figure 4.
Kaplan–Meier curves for distant metastasis-free survival (DMFS) analysis in relation to rs1042602 genotype (CA vs. AA) in patients with stage III melanomas and 5 years of follow-up. (A) Men and women (p-value = 0.011) and (B) men (p-value = 0.010). Log-rank test p-values are also indicated in each figure.

