Figure 5.
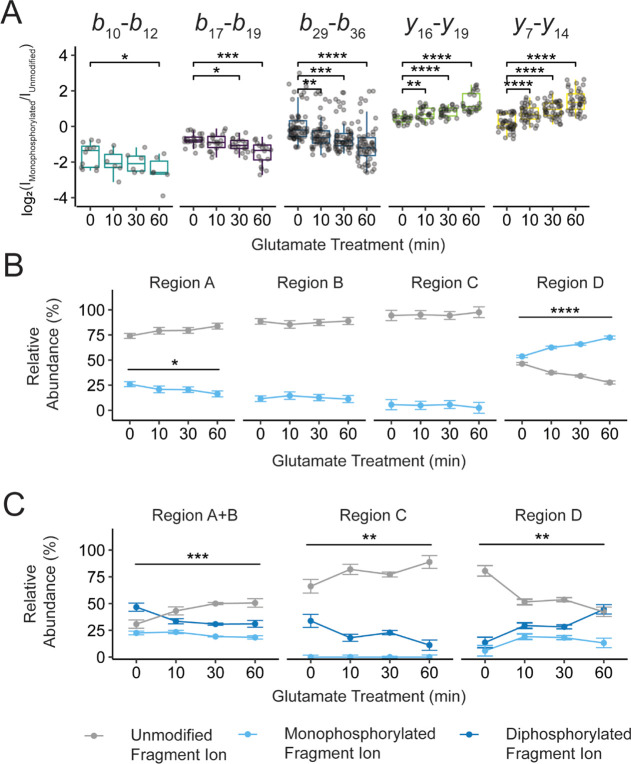
mGluR2 activation dynamically shifts positional phosphorylation abundance over time. (A) The difference in log 2 (fragment ion intensity) for unmodified and monophosphorylated fragment ions derived from the monophosphorylated precursor population shows statistically significant changes in phosphorylation position over 1 mM l-glutamic acid treatment (0 to 60 min). The population of averaged fragment ions is listed above each box plot. These ratios of fragment ions can be converted into relative percentages showing phosphorylation content within a defined region. Relative phosphorylation content was calculated for the (B) mono- and (C) diphosphorylated precursor populations. Color fill denotes the number of phosphorylations localized within a given region using fragment ions from the PRM assay. No phosphorylation is denoted with gray, monophosphorylation is denoted with light blue, and diphosphorylation is denoted with dark blue. Error bars represent the standard error of the mean (N = 3 biological replicates and 3 technical replicates). Brackets indicate a statistical comparison between two data points using a Wilcoxon–Mann–Whitney test. Significant differences are denoted as follows: * = p < 0.05, ** = p ≤ 0.01, *** = p ≤ 0.001, **** = p ≤ 0.0001.

