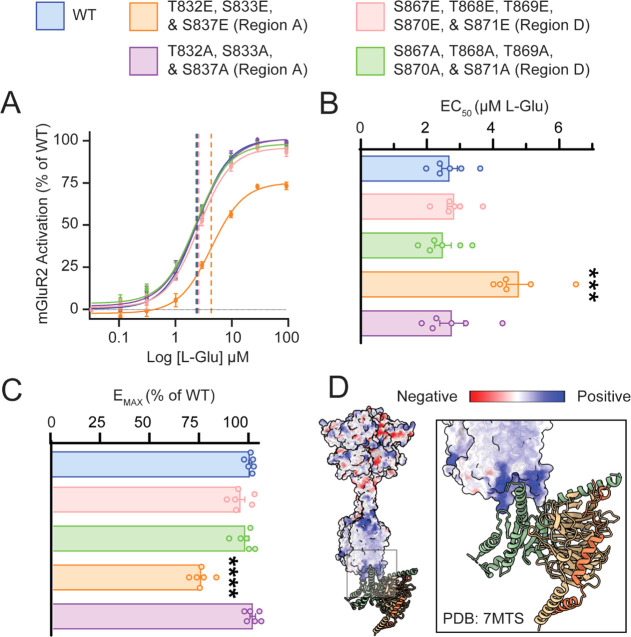
Figure 6.
Intracellular phosphorylation states fine-tune mGluR2 signaling. (A) Dose–response curves for wild-type mGluR2 (blue); T832E, S833E, and S837E mGluR2 (orange); T832A, S833A, and S837A mGluR2 (purple); S867E, T868E, T869E, S870E, and S871E mGluR2 (pink); and S867A, T868A, T869A, S870A, and S871A mGluR2 (green). Quantification of (B) half-maximal effective concentration (EC50) and (C) maximal efficacy (EMAX) for l-glutamic acid. (D) Coulombic electrostatic potential map for CryoEM structure 7MTS; inset shows the intracellular pocket of mGluR2 complexed with Gi. Error bars represent the standard error of the mean (N = 3 biological replicates and 2 technical replicates). Asterisks indicate a statistical comparison using a one-way ANOVA with multiple comparisons to WT. Significant differences are denoted as follows: *** = p ≤ 0.001, **** = p ≤ 0.0001.

