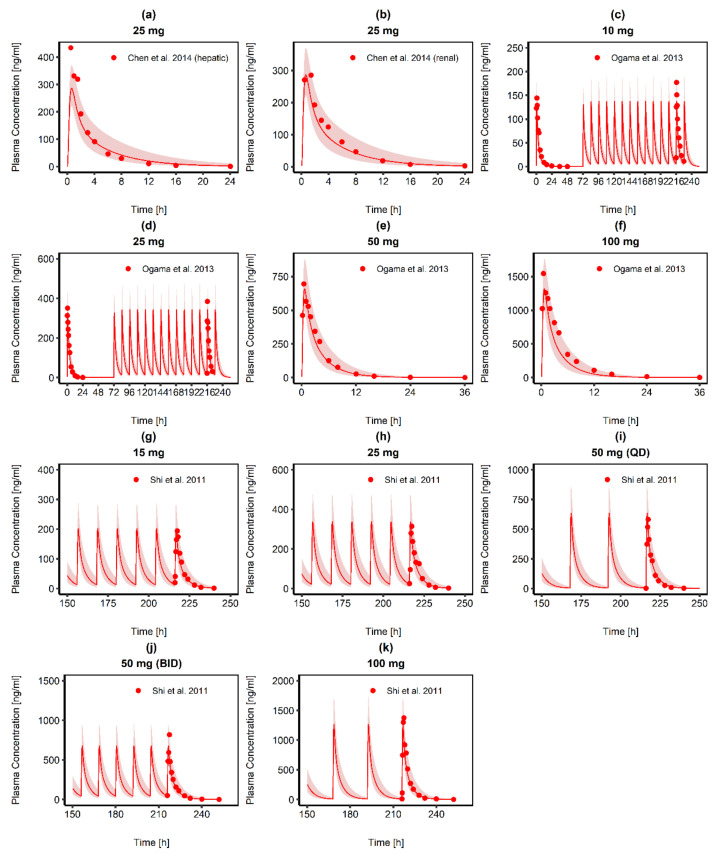
Figure 2.
Predicted RUX plasma concentration-time curve profiles (solid red lines) and observed RUX concentrations (red dots), obtained after single (a,b,e,f) and multiple RUX tablet (c,d,g–k) administration. The red shaded area represents the predicted population geometric standard deviation in each case. The ESM contains detailed information about the study protocols and RUX model performance for each simulation. QD: once daily, BID: twice daily. Source: [38,39,40].

