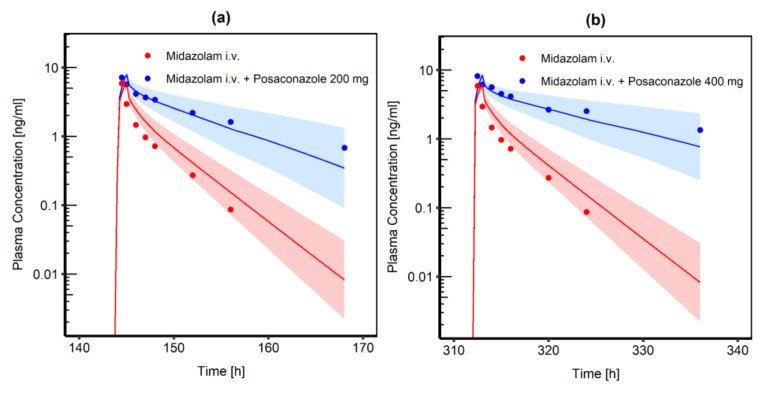
Figure 3.
Comparison of simulated MDZ venous blood plasma concentration-time profiles (semilogarithmic) following i.v. administration of 0.4 mg MDZ infusion. The blue shaded area represents the geometric mean SD for population simulations of the resulting MDZ plasma concentrations if co-administered with either (a) 200 mg oral POS or (b) 400 mg oral POS and an inhibitory constant Ki = 5.22 nmol/L for the CYP3A4 interaction process. The red shaded area represents the geometric mean SD for population simulations without concomitant POS administration. Geometric means are shown as a blue line (with POS administration) or a red line (without POS administration). Observed data are shown as blue and red dots, respectively.

