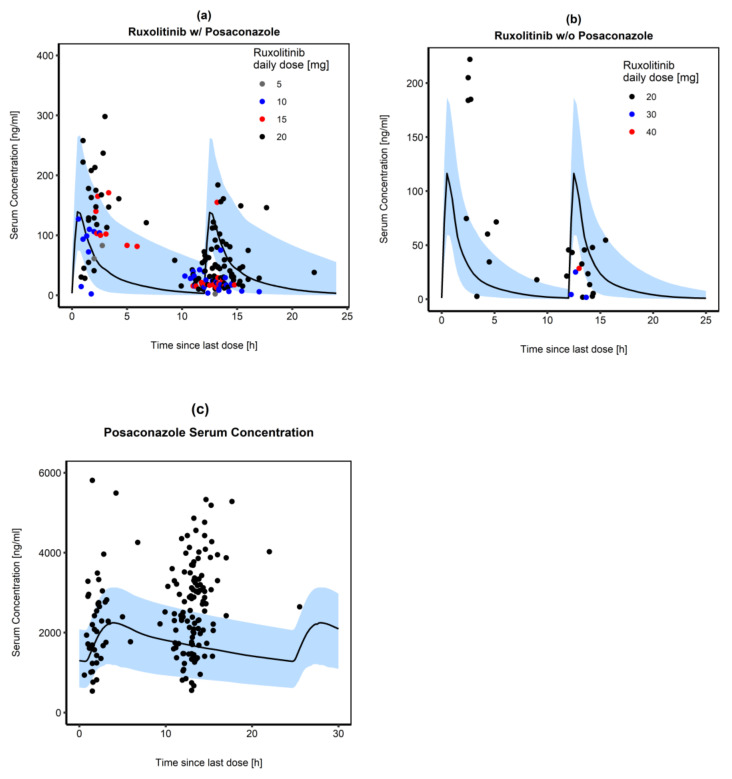
Figure 4.
Comparison of simulated RUX serum concentration-time profiles following oral administration (10 mg BID) if (a) co-administered with 300 mg oral POS and (b) given without its perpetrator. Observed RUX concentrations are shown as dots with different colors, representing different RUX daily doses actually taken by the patients. Median RUX concentrations are shown as a black line in each part. Part (c) represents predicted (black solid line) and observed POS concentrations (black dots) after administration of 300 mg oral POS tablet once daily. The blue shaded areas represent the 5% to 95% prediction intervals for population simulations (n = 100) of the resulting RUX and POS plasma concentrations, respectively.

