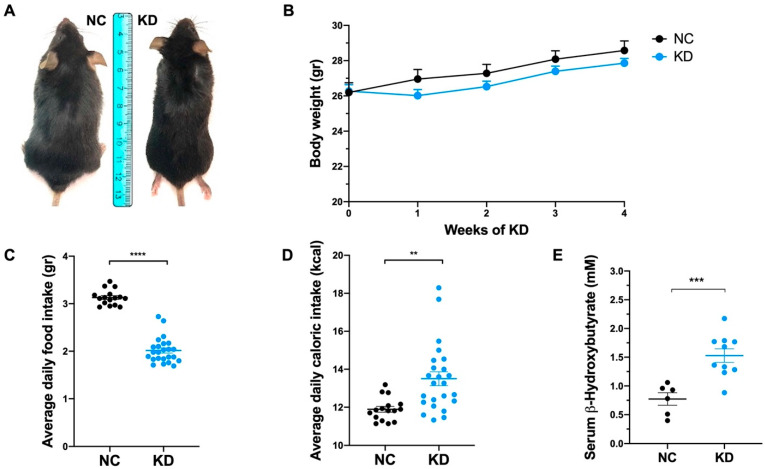
Figure 1.
Ketogenic diet effects on body weight and food intake. (A) Representative photographs of mice under normal chow (NC) and ketogenic diet (KD) at the end of dietary treatment. (B) Body weight analysis during dietary treatment showing weight gain (g) of mice under NC (n = 8) and KD (n = 10). Data are expressed as mean ± SEM. (C) Scatter dot plot showing average daily food intake (g) of mice under NC and KD. Data are expressed as mean ± SEM. **** p < 0.001. (D) Scatter dot plot showing average daily caloric intake (kcal) of mice under NC and KD. Data are expressed as mean ± SEM. ** p < 0.01. (E) Dot plot showing βHB concentration (mM) in serum from mice under NC (n = 6) and KD (n = 10) at the end of dietary treatment. Data are expressed as mean ± SEM. *** p < 0.005.

