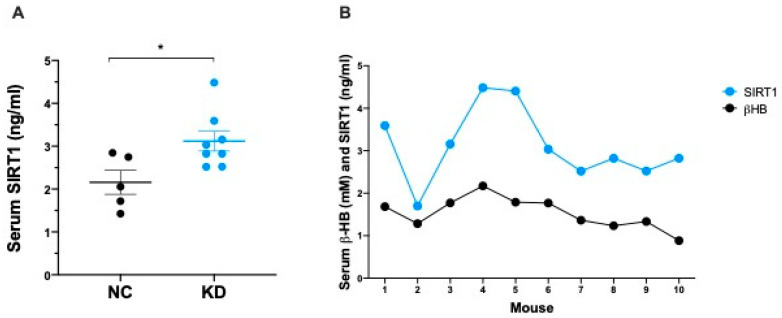
Figure 3.
(A) Dot plot showing SIRT1 concentration (ng/mL) in serum from mice under NC (n = 5) and KD (n = 8) at the end of dietary treatment. Data are expressed as mean ± SEM. * p < 0.05. (B) Pearson correlation analysis between serum βHB and SIRT1 levels in mice under KD (n = 10). r = 0.732, p = 0.0156.

