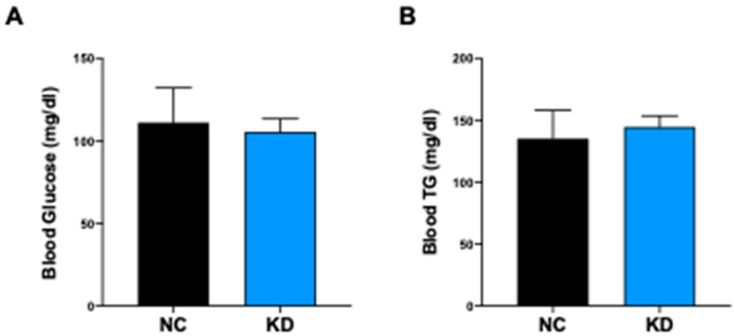
Figure 6.
Ketogenic diet effect on blood levels of glucose and triglycerides. (A) Bar plot showing serum fasting glucose concentration (mg/dL) from mice under NC (n = 8) and KD (n = 10) at the end of dietary treatment. (B) Bar plot showing triglycerides (TG) serum concentration (mg/dL) from mice under NC (n = 8) and KD (n = 10) at the end of dietary treatment. Data are expressed as mean ± SEM.

