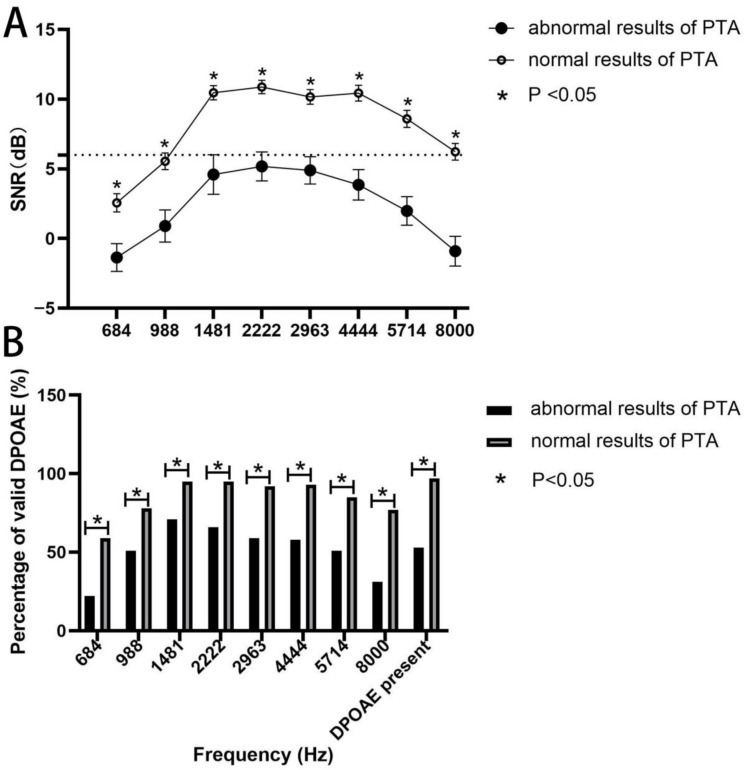
Figure 3.
Association of DPOAE results with PTA. (A) SNR values in the ears of SLE patients with and without normal PTA at different frequencies. The dashed line indicates normal SNR value (6 dB). Data are presented as mean ± SEM and the mean values at each F2 frequency are linked by the trend line. p < 0.05 by t-test. (B) Percentages of valid DPOAE in the ears of SLE patients with and without normal PTA at different frequencies. p < 0.05 by chi-squared test. DPOAE: distortion product otoacoustic emission; PTA: pure tone audiometry; SNR: signal-to-noise ratio.

