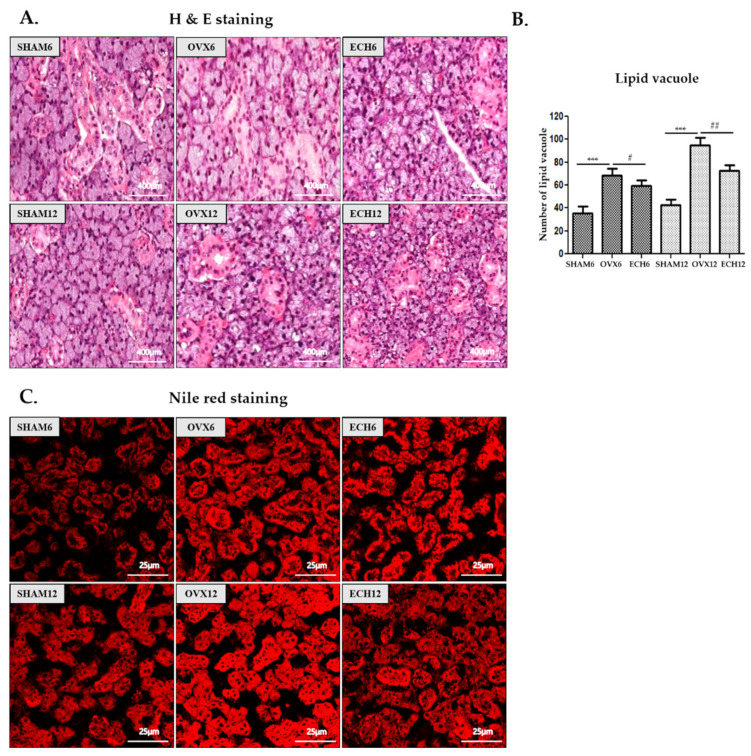
Figure 2.
Effect of Ech A on lipid deposition. The lipid deposition was higher in the OVX groups but lower in the Ech A treatment groups. (A) Lipid vacuoles (yellow arrows) were detected in the submandibular gland after H and E staining. We counted intracellular lipid vacuoles, primarily distributed between acini cells or in the cytoplasm of serous cells. (B) Morphometric analysis of lipid vacuoles. (C) Nile red staining of rat submandibular gland. Positive Nile red staining was revealed in the cytoplasm of acinar cells, increased in the OVX groups, and decreased in the ECH groups of in the cytoplasm of acinar cells. n = 8, each group. Error bar; S.D. One-way ANOVA; *** p < 0.001; vs. SHAM, # p < 0.05, ## p < 0.01; vs. OVX.

