Figure 3.
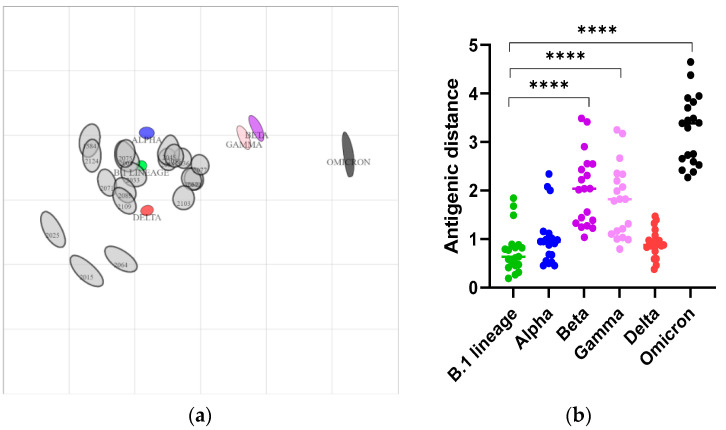
Construction of antigen cartography based on the NT50 of serum samples collected from deer. (a) Two-dimensional antigenic map of the SARS-CoV-2 B.1 lineage, the Alpha, Beta, Gamma, Delta, and Omicron variants, and the serum samples collected from the deer. The SARS-CoV-2 strains and serum samples are shown as blobs, as estimated using stress parameter 0.1. The SARS-CoV-2 B.1 lineage, and the Alpha, Beta, Gamma, Delta, and Omicron variants are indicated in green, blue, purple, pink, red, and black, respectively, and each gray blob corresponds to serum from one deer. Both the axes of the map are antigenic distant, and each grid square represents 1 antigenic unit, which is a three-fold serum dilution (two antigenic units correspond to nine-fold serum dilution, and so on) in the pseudovirus neutralization assay. The distance between points is a measure of antigenic similarity, with closer positions indicating higher antigenic similarity. (b) The distances of antigenic units between SARS-CoV-2 and the serum samples. The mean distance between the serum samples and the B.1 lineage, Alpha, and Delta variants was low, compared to the Beta, Gamma, and Omicron variants. p value < 0.05 are significant, **** p < 0.0001.

