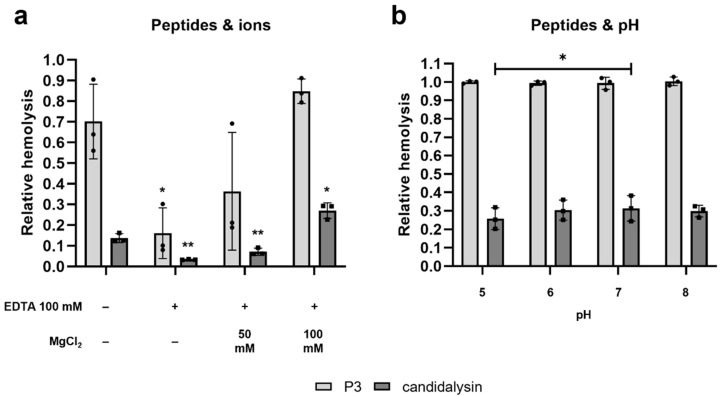
Figure 3.
Candidalysin and P3-induced hemolysis is ion-dependent and pH-independent. Purified RBCs were incubated with candidalysin or P3 (9 µM, Proteogenix) for 1 h at 37 °C. (a) ± EDTA ± MgCl2 at the indicated concentrations. (b) In buffered Hank’s balanced salt solution (HBSS) media at different pHs. Hemolysis was quantified by measuring the absorbance of sample’s supernatant at 414 nm, and plotted relative to the full lysis control sample (RBCs incubated with pure water), following subtraction of the vehicle control. Each data point on the graph represents a different donor (average of 2 technical replicates). Error bars show the standard deviation. For statistical analysis, data were log-transformed and in (a) a student’s paired t-tests, vs. the relative peptide-only sample, was performed. In (b), a repeated measures one-way ANOVA analysis was performed, with a post hoc Tukey’s multiple comparison test across samples treated with the same peptide *, p < 0.05; **, p < 0.01.

