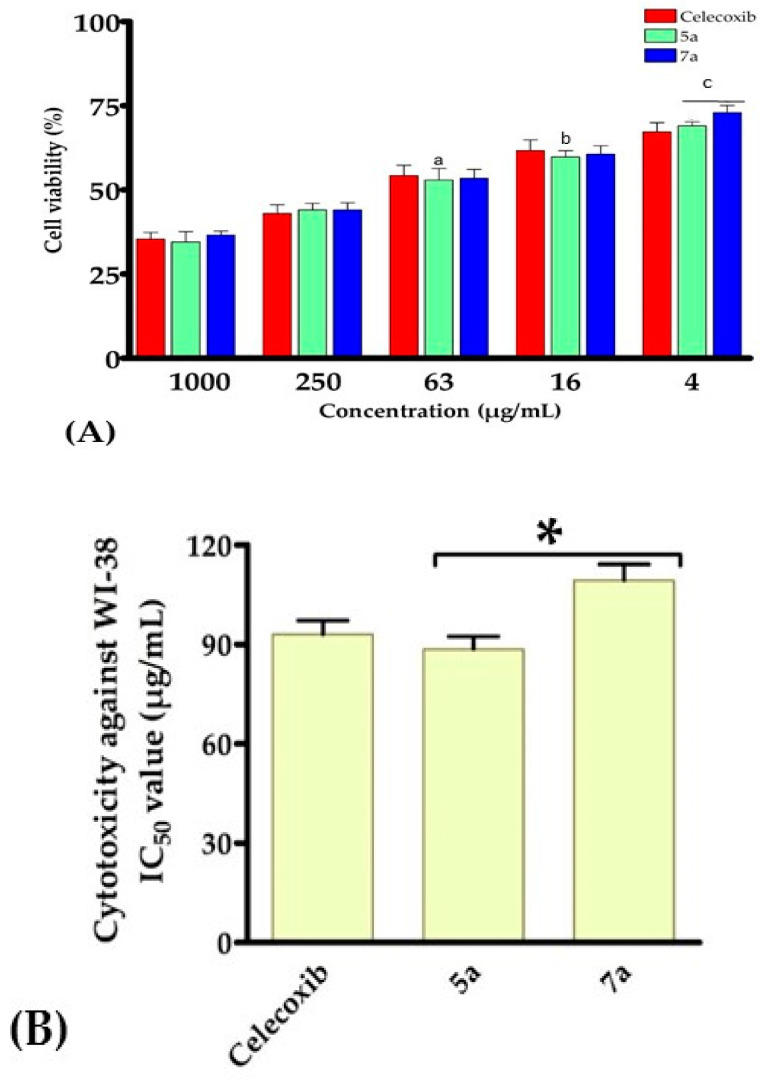
Figure 5.
In vitro cytotoxicity of compounds 5a and 7a against WI-38 cell line (n = 4). (A) Percentage of cell viability in different concentrations. (B) IC50 values (μg/mL). Data are presented as mean ± SD. a p < 0.05 versus celecoxib at concentration (63 μg/mL), b p < 0.05 versus celecoxib at concentration (16 μg/mL), c p < 0.05 versus celecoxib at concentration (4 μg/mL) * p < 0.05 versus celecoxib for the IC50 value.

