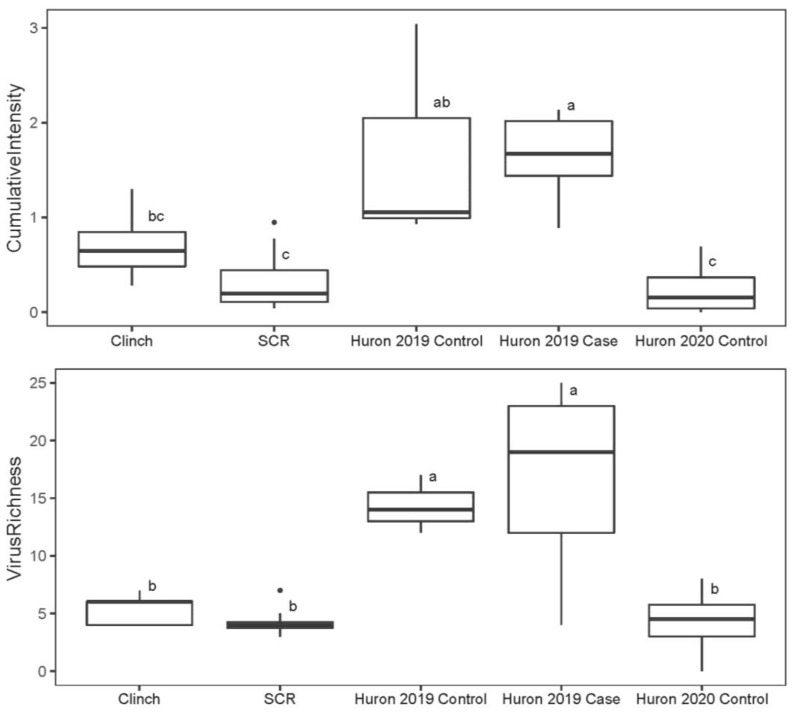
Figure 2.
Boxplots of cumulative viral intensity (top) and viral richness (bottom) for mucket populations from the Clinch River, St. Croix River (SCR), and subgroups from the Huron River. Individual points represent outliers in the data. Boxes depict median and first and third quartiles for each group. Letters depict results from Tukey HSD analysis. Boxes with the same letters are not statistically different (i.e., adjusted p-value ≥ 0.05).

