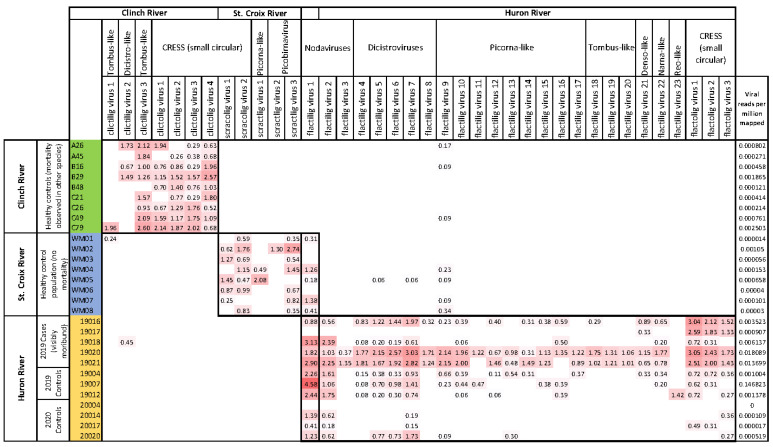
Figure 4.
Heatmap of viral read depths (vRPM/kb) in mucket from the Clinch River, St. Croix River, and Huron River. Individual mussels are on rows, viruses are on columns. Labels identifying each virus correspond to those in Table S2. Thick borders depict the individuals corresponding to populations from which viruses were detected. The overlapping thick border for column 13 corresponds to the only virus that was independently detected in two study populations. Viral reads per million mapped (far right column) represents the number of reads per million from the 1 million read subsample that mapped to the viruses shown in the figure. A larger version of this figure is available in Supplementary Table S4.

