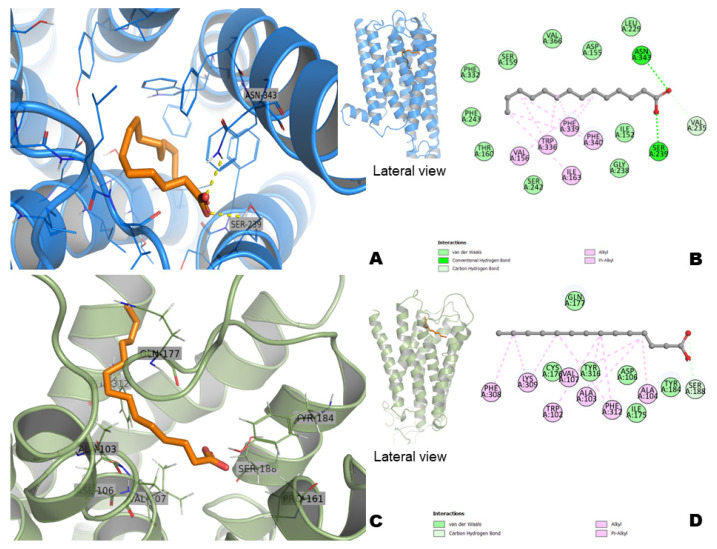
Figure 11.
The docking complexes of myristic acid with 5-HT2A (A,B) and α1A-adrenergic receptor (C,D). Myristic acid is shown in stick representation (orange color). The elements are colored as follows: oxygen, red; nitrogen, blue; carbon, marine color to 5-HT2A and smudged color to α1A-adrenergic receptor. Dashed lines (yellow color) represent the hydrogen bonds and van der Waals interactions (pink and pale green colors).

