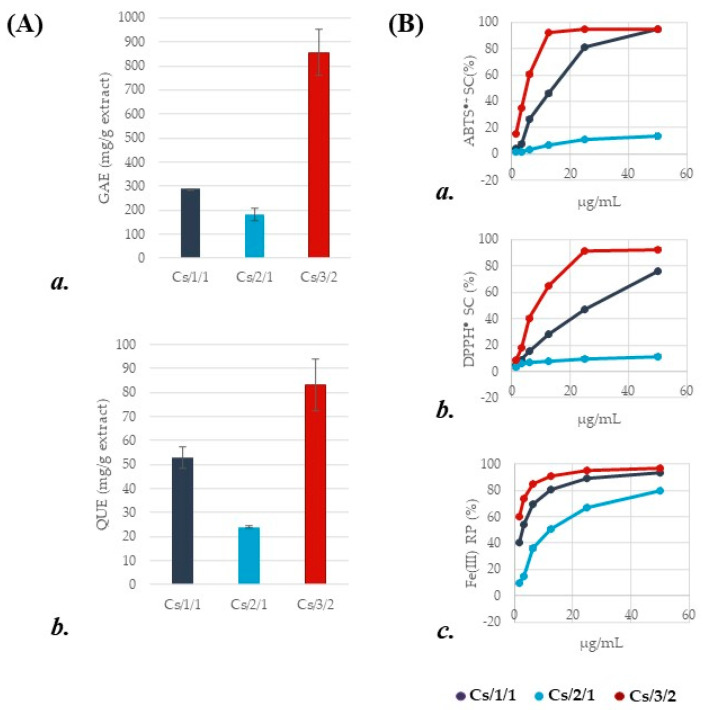
Figure 2.
(A) (a) Total phenolic content (TPC), expressed as mg of gallic acid equivalents (GAEs) per g of extract; (b) total flavonoid content (TFC), expressed as mg of quercetin equivalents (QUEs) per g of extract. Values reported are the mean ± SD of three independent measurements. (B) (a) Scavenging capability (SC%) vs. 2,2′-azino-bis(3-ethylbenzothiazoline)-6-sulfonic acid (ABTS) radical cation; (b) scavenging capability (SC%) vs. 2,2-diphenyl-1-picrylhydrazy (DPPH) radical, and (c) Fe(III) reducing power (RP%) of C. sativa extract and organic fractions therefrom. Values reported are the mean ± SD of three independent measurements.

