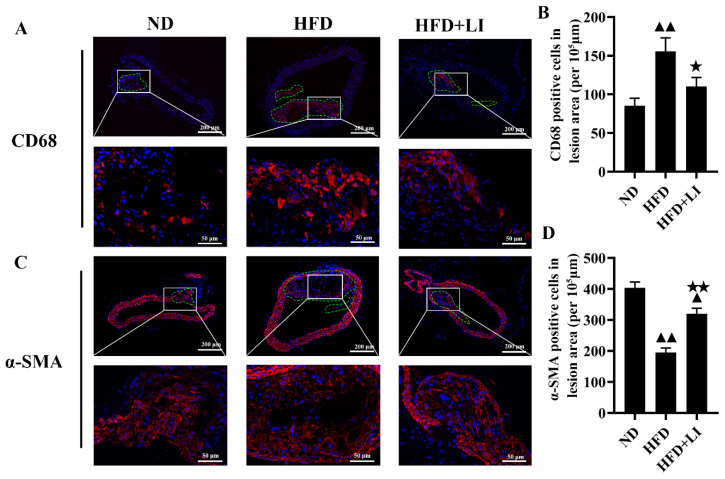
Figure 2.
Effects of low dietary iron on ApoE KO mice aortic macrophages and smooth muscle cells. (A) Representative immunofluorescent staining images of macrophages in a murine atherosclerotic plaque. Nuclei were stained with DAPI (blue), and CD68-positive macrophages were revealed by Alexa Fluor 594 (red). (B) Quantification of (A) (% positive area). (C) Representative immunofluorescent staining images of smooth muscle cells in murine atherosclerotic plaque. Nuclei were stained with DAPI (blue), and αSMA-positive smooth muscle cells were revealed by Alexa Fluor 594 (red). (D): Quantification of (C) (percentage positive area). Scale bar = 50 μm. ▲▲ p < 0.01 vs. ND; ★ p < 0.05 vs. HFD; ★★ p < 0.01 vs. HFD. ND: normal diet-fed ApoE KO mice, HFD: high fat diet-fed ApoE KO mice, HFD + LI: high fat diet without iron supplementation-fed ApoE KO mice.ND: normal diet, HFD: high-fat diet, HFD + LI: high-fat diet without iron supplementation.

