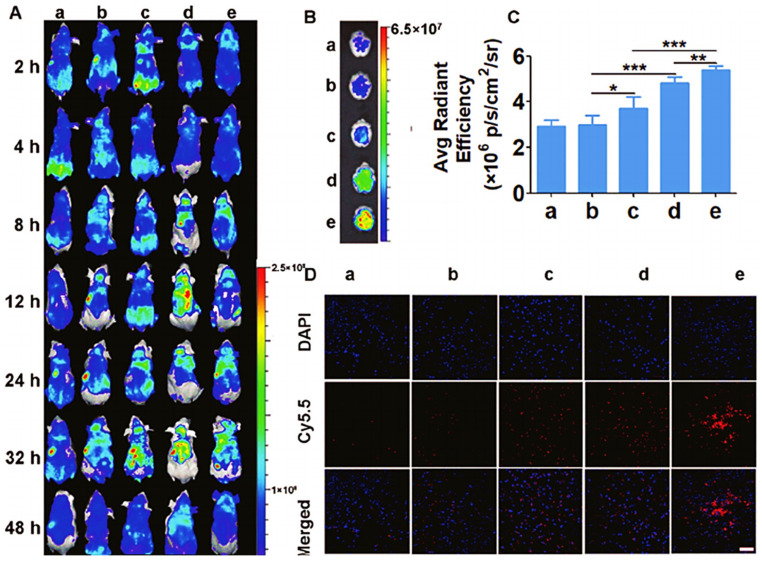
Figure 5.
In vivo organ imaging studies. (A) Optical imaging of various nanoparticles administered at different time intervals. (B) Images of the brain after 24 h of administration. (C) Measurement of fluorescence intensity of the brains among different groups at 24 h. (D) CLSM images showing the build-up of nanoparticles in the brain. Here: * p ≤ 0.05; ** p ≤ 0.01; *** p ≤ 0.001. (a) D-D/siRNA; (b) D-DT7/siRNA; (c) D-DCT7/siRNA; (d) D-DTT7/siRNA; (e) D-DTCT7/siRNA. Scale bar represents 50 µm. Adopted with permission from [94].

