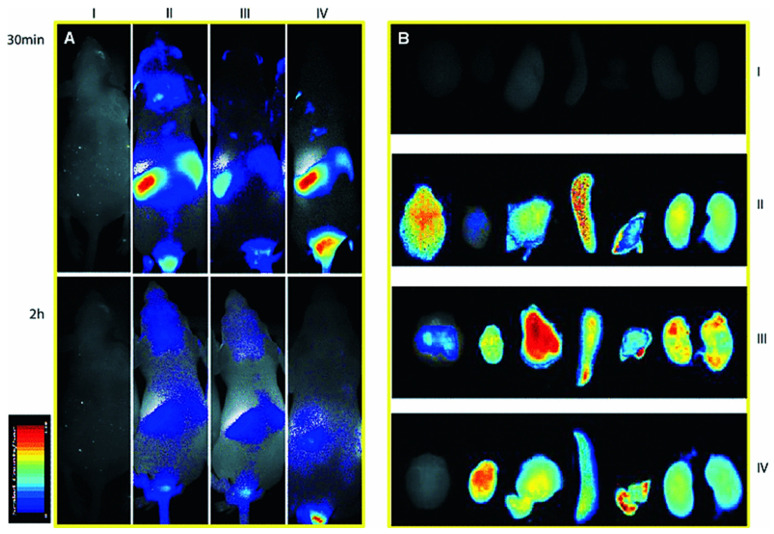
Figure 8.
PepC7 in vivo distribution. (A) I-Blank control: PBS administered mouse, II-Cy5.5PepC7, III-Cy5.5Pep7, IV-Cy5.5PepSC7. Images were captured after 30 min and 2 h. (B) Similarly, ex vivo organ distribution was studied in the same group as listed in A. Adopted with permission [161].

