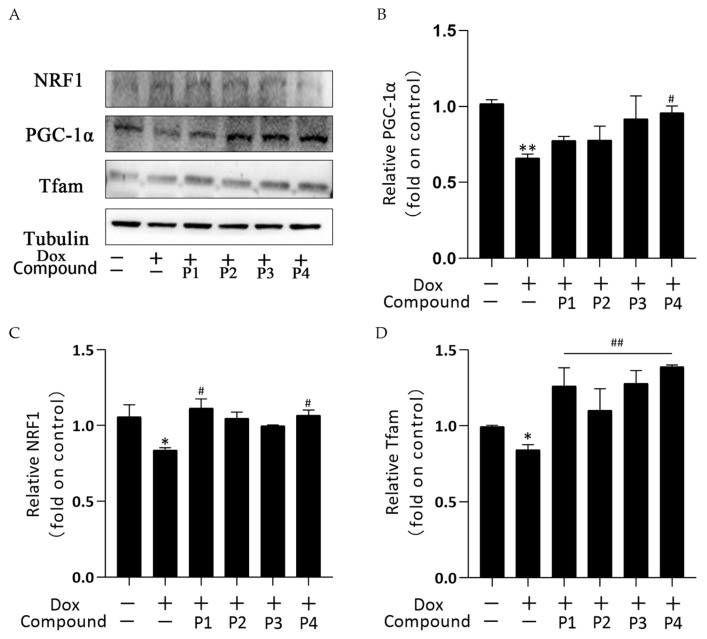
Figure 7.
Effects of Hippophae rhamnoides L. phenylpropanoids on mitochondrial biogenesis in zebrafish. (A) PGC-1α, NRF1, and Tfam protein expression determined using western blotting. (B) Column chart of quantitative analysis of PGC-1α protein expression in zebrafish. (C) Column chart of quantitative analysis of NRF1 protein expression in zebrafish. (D) Column chart of quantitative analysis of Tfam protein expression in zebrafish. * p < 0.05, ** p < 0.01 vs. the control group; # p < 0.05, ## p < 0.01 vs. the Dox group.

