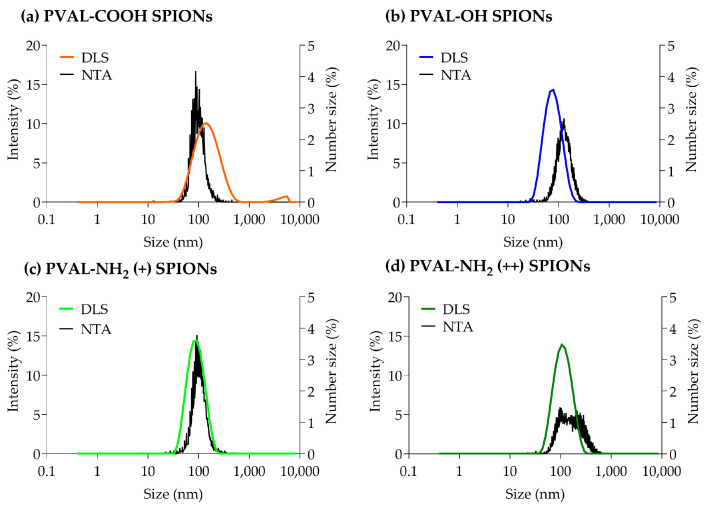
Figure 1.
Graphs obtained from DLS and NTA particle size measurements for (a) PVAL-COOH SPIONs, (b) PVAL-OH SPIONs, (c) PVAL-NH2 SPIONs (+) and (d) PVAL-NH2 SPIONs (++). DLS size distribution was plotted as a percentage of the total intensity (left axis). NTA size distribution was plotted as a percentage of the total number of measured NPs (right axis).

