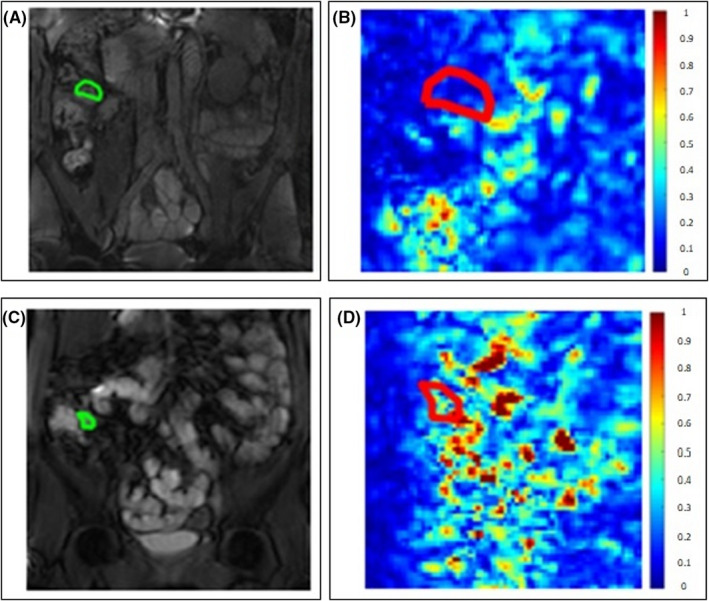
FIGURE 5.

Two examples of coronal motility maps based on the standard deviation of the Jacobian determinant with color bar showing low (blue) to high (red) motility. A region of interest was drawn in the terminal ileum on the reference frame (A and C) with low motility seen in the patient with distension (B) and high motility seen in the healthy control (D)
