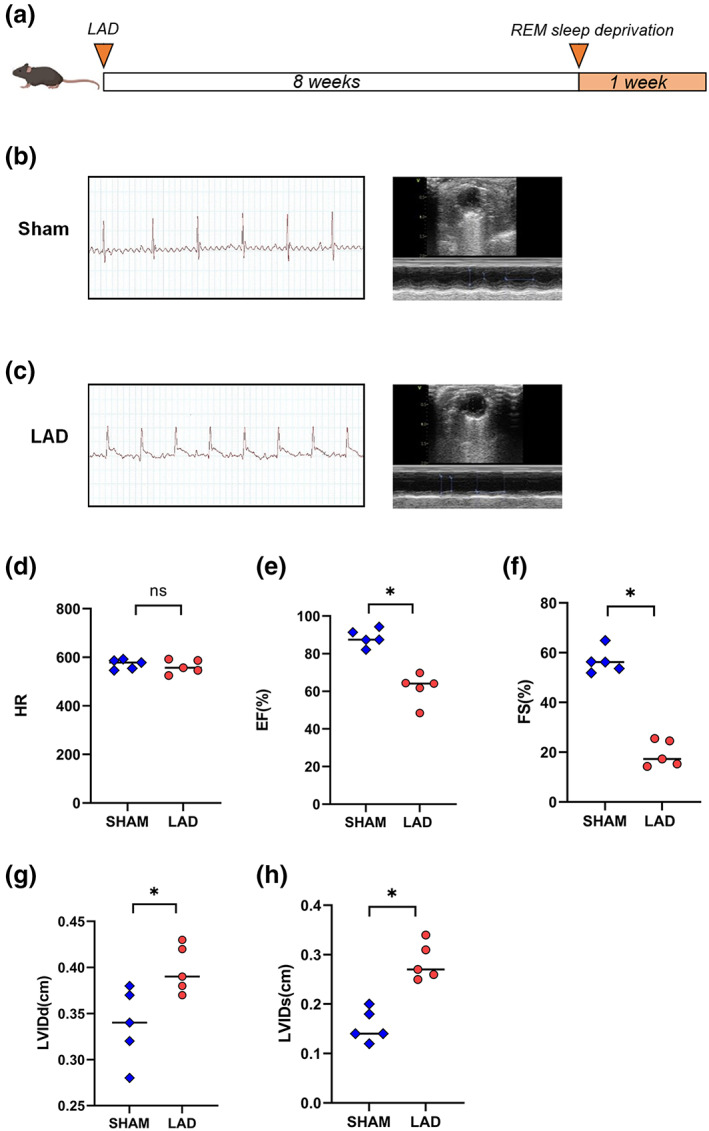
FIGURE 1.

Confirmation of the LAD model and examination of left ventricular function in mice. (a) Schematic of the timeline for the animal experiment in which mice were subjected to sleep deprivation 8 weeks after LAD model establishment. (b) Electrocardiogram of control mice without ST segment elevation. (c) Electrocardiogram of LAD model mice with ST segment elevation. (d) The comparison of the HRs of mice in the LAD and sham groups is shown. (e) The comparison of the EF of mice in the LAD and sham groups is shown. The significance of differences between groups was determined using Welch's t‐test (n = 5, *p < 0.05). (f) The comparison of the FS in mice from the LAD and sham groups is shown. The significance of differences between groups was determined using Welch's t‐test (n = 5, *p < 0.05). (g) The comparison of the LVIDd of mice in the LAD and sham groups is shown. The significance of differences between groups was determined using Welch's t‐test (n = 5, *p < 0.05). (h) The comparison of the LVIDs of mice in the LAD and sham groups is shown. The significance of differences between groups was determined using Welch's t‐test (n = 5, *p < 0.05)
