FIGURE 5.

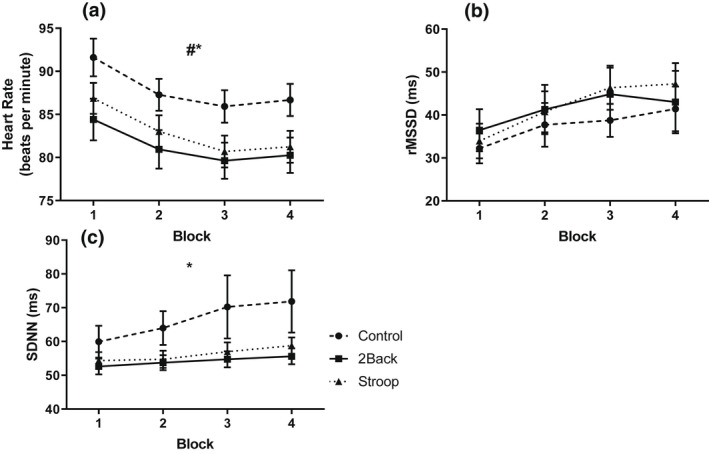
Heart rate (a), rMSSD (b), and SDNN (c) during the handgrip task as a function of block and group. # (p < .05) Significant main effect of group. * (p < .001) Significant main effect of block. Data presented as M ± SEM.

Heart rate (a), rMSSD (b), and SDNN (c) during the handgrip task as a function of block and group. # (p < .05) Significant main effect of group. * (p < .001) Significant main effect of block. Data presented as M ± SEM.